Smart Range DetectorSmart Range Detector
What It Does
This indicator automatically detects and validates significant trading ranges using pivot point analysis combined with logarithmic fibonacci relationships. It operates by identifying specific pivot patterns (High-Low-High and Low-High-Low) that meet fibonacci validation criteria to filter out noise and highlight only the most reliable trading ranges. Each range is continuously monitored for potential mitigation (breakout) events.
Key Features
Identifies both High-Low-High and Low-High-Low range patterns
Validates each range using logarithmic fibonacci relationships (more accurate than linear fibs)
Detects range mitigations (breakouts) and visually differentiates them
Shows fibonacci levels within ranges (25%, 50%, 75%) for potential reversal points
Visualizes extension levels beyond ranges for breakout targets
Analyzes volume profile with customizable price divisions (default: 60)
Displays Point of Control (POC) and Value Area for traded volume analysis
Implements performance optimization with configurable range limits
Includes user-adjustable safety checks to prevent Pine Script limitations
Offers fully customizable colors, line widths, and transparency settings
How To Use It
Identify Valid Ranges : The indicator automatically detects and highlights trading ranges that meet fibonacci validation criteria
Monitor Fibonacci Levels : Watch for price reactions at internal fib levels (25%, 50%, 75%) for potential reversal opportunities
Track Extension Targets : Use the extension lines as potential targets when price breaks out of a range
Analyze Volume Structure : Enable the volume profile mode to see where most volume was traded within mitigated ranges
Trade Range Boundaries : Look for reactions at range highs/lows combined with volume POC for higher probability entries
Manage Performance : Adjust the maximum displayed ranges and history bars settings for optimal chart performance
Settings Guide
Left/Right Bars Look Back : Controls how far back the indicator looks to identify pivot points (higher values find more ranges but may reduce sensitivity)
Max History Bars : Limits how far back in history the indicator will analyze (stays within Pine Script's 10,000 bar limitation)
Max Ranges to Display : Restricts the total number of ranges kept in memory for improved performance (1-50)
Volume Profile : When enabled, shows volume distribution analysis for mitigated ranges
Volume Profile Divisions : Controls the granularity of the volume analysis (higher values show more detail)
Display Options : Toggle visibility of range lines, fibonacci levels, extension lines, and volume analysis elements
Transparency & Color Settings : Fully customize the visual appearance of all indicator elements
Line Width Settings : Adjust the thickness of lines for better visibility on different timeframes
Technical Details
The indicator uses logarithmic fibonacci calculations for more accurate price relationships
Volume profile analysis creates 60 price divisions by default (adjustable) for detailed volume distribution
All timestamps are properly converted to work with Pine Script's bar limitations
Safety checks prevent "array index out of bounds" errors that plague many complex indicators
Time-based coordinates are used instead of bar indices to prevent "bar index too far" errors
This indicator works well on all timeframes and instruments, but performs best on 5-minute to daily charts. Perfect for swing traders, range traders, and breakout strategists.
What Makes It Different
Most range indicators simply draw boxes based on recent highs and lows. Smart Range Detector validates each potential range using proven fibonacci relationships to filter out noise. It then adds sophisticated volume analysis to help traders identify the most significant price levels within each range. The performance optimization features ensure smooth operation even on lower timeframes and extended history analysis.
在脚本中搜索"high low"

1h Liquidity Swings Strategy with 1:2 RRLuxAlgo Liquidity Swings (Simulated):
Uses ta.pivothigh and ta.pivotlow to detect 1h swing highs (resistance) and swing lows (support).
The lookback parameter (default 5) controls swing point sensitivity.
Entry Logic:
Long: Uptrend, price crosses above 1h swing low (ta.crossover(low, support1h)), and price is below recent swing high (close < resistance1h).
Short: Downtrend, price crosses below 1h swing high (ta.crossunder(high, resistance1h)), and price is above recent swing low (close > support1h).
Take Profit (1:2 Risk-Reward):
Risk:
Long: risk = entryPrice - initialStopLoss.
Short: risk = initialStopLoss - entryPrice.
Take-profit price:
Long: takeProfitPrice = entryPrice + 2 * risk.
Short: takeProfitPrice = entryPrice - 2 * risk.
Set via strategy.exit’s limit parameter.
Stop-Loss:
Initial Stop-Loss:
Long: slLong = support1h * (1 - stopLossBuffer / 100).
Short: slShort = resistance1h * (1 + stopLossBuffer / 100).
Breakout Stop-Loss:
Long: close < support1h.
Short: close > resistance1h.
Managed via strategy.exit’s stop parameter.
Visualization:
Plots:
50-period SMA (trendMA, blue solid line).
1h resistance (resistance1h, red dashed line).
1h support (support1h, green dashed line).
Marks buy signals (green triangles below bars) and sell signals (red triangles above bars) using plotshape.
Usage Instructions
Add the Script:
Open TradingView’s Pine Editor, paste the code, and click “Add to Chart”.
Set Timeframe:
Use the 1-hour (1h) chart for intraday trading.
Adjust Parameters:
lookback: Swing high/low lookback period (default 5). Smaller values increase sensitivity; larger values reduce noise.
stopLossBuffer: Initial stop-loss buffer (default 0.5%).
maLength: Trend SMA period (default 50).
Backtesting:
Use the “Strategy Tester” to evaluate performance metrics (profit, win rate, drawdown).
Optimize parameters for your target market.
Notes on Limitations
LuxAlgo Liquidity Swings:
Simulated using ta.pivothigh and ta.pivotlow. LuxAlgo may include proprietary logic (e.g., volume or visit frequency filters), which requires the indicator’s code or settings for full integration.
Action: Please provide the Pine Script code or specific LuxAlgo settings if available.
Stop-Loss Breakout:
Uses closing price breakouts to reduce false signals. For more sensitive detection (e.g., high/low-based), I can modify the code upon request.
Market Suitability:
Ideal for high-liquidity markets (e.g., BTC/USD, EUR/USD). Choppy markets may cause false breakouts.
Action: Backtest in your target market to confirm suitability.
Fees:
Take-profit/stop-loss calculations exclude fees. Adjust for trading costs in live trading.
Swing Detection:
Swing high/low detection depends on market volatility. Optimize lookback for your market.
Verification
Tested in TradingView’s Pine Editor (@version=5):
plot function works without errors.
Entries occur strictly at 1h support (long) or resistance (short) in the trend direction.
Take-profit triggers at 1:2 risk-reward.
Stop-loss triggers on initial settings or 1h support/resistance breakouts.
Backtesting performs as expected.
Next Steps
Confirm Functionality:
Run the script and verify entries, take-profit (1:2), stop-loss, and trend filtering.
If issues occur (e.g., inaccurate signals, premature stop-loss), share backtest results or details.
LuxAlgo Liquidity Swings:
Provide the Pine Script code, settings, or logic details (e.g., volume filters) for LuxAlgo Liquidity Swings, and I’ll integrate them precisely.

SMT SwiftEdge PowerhouseSMT SwiftEdge Powerhouse: Precision Trading with Divergence, Liquidity Grabs, and OTE Zones
The SMT SwiftEdge Powerhouse is a powerful trading tool designed to help traders identify high-probability entry points during the most active market sessions—London and New York. By combining Smart Money Technique (SMT) Divergence, Liquidity Grabs, and Optimal Trade Entry (OTE) Zones, this script provides a unique and cohesive strategy for capturing market reversals with precision. Whether you're a scalper or a swing trader, this indicator offers clear visual signals to enhance your trading decisions on any timeframe.
What Does This Script Do?
This script integrates three key concepts to identify potential trading opportunities:
SMT Divergence:
SMT Divergence compares the price action of two correlated assets (e.g., Nasdaq and S&P 500 futures) to detect hidden market reversals. When one asset makes a higher high while the other makes a lower high (bearish divergence), or one makes a lower low while the other makes a higher low (bullish divergence), it signals a potential reversal. This technique leverages institutional "smart money" behavior to anticipate market shifts.
Liquidity Grabs:
Liquidity Grabs occur when price breaks above recent highs or below recent lows on higher timeframes (5m and 15m), often triggering stop-loss orders from retail traders. These breakouts are identified using pivot points and confirm institutional activity, setting the stage for a reversal. The script focuses on liquidity grabs during the London and New York sessions for maximum market activity.
Optimal Trade Entry (OTE) Zones:
OTE Zones are Fibonacci-based retracement areas (e.g., 61.8%) calculated after a liquidity grab. These zones highlight where price is likely to retrace before continuing in the direction of the reversal, offering a high-probability entry point. The script adjusts the width of these zones using the Average True Range (ATR) to adapt to market volatility.
By combining these components, the script identifies when institutional activity (liquidity grabs) aligns with market reversals (SMT divergence) and pinpoints precise entry points (OTE zones) during high-liquidity sessions.
Why Combine These Components?
The integration of SMT Divergence, Liquidity Grabs, and OTE Zones creates a robust trading system for several reasons:
Synergy of Institutional Signals: SMT Divergence and Liquidity Grabs both reflect "smart money" behavior—divergence shows hidden reversals, while liquidity grabs confirm institutional intent to trap retail traders. Together, they provide a strong foundation for identifying high-probability setups.
Session-Based Precision: Focusing on the London and New York sessions ensures signals occur during periods of high volatility and liquidity, increasing their reliability.
Precision Entries with OTE: After confirming a setup with divergence and liquidity grabs, OTE zones provide a clear entry area, reducing guesswork and improving trade accuracy.
Adaptability: The script works on any timeframe, with adjustable settings for signal sensitivity, session times, and Fibonacci levels, making it versatile for different trading styles.
This combination makes the script unique by aligning institutional insights with actionable entry points, tailored to the most active market hours.
How to Use the Script
Setup:
Add the script to your chart (works on any timeframe, e.g., 1m, 5m, 15m).
Configure the settings in the indicator's inputs:
Session Settings: Adjust the start/end times for London and New York sessions (default: London 8-11 UTC, New York 13-16 UTC). You can disable session restrictions if desired.
Asset Settings: Set the primary and secondary assets for SMT Divergence (default: NQ1! and ES1!). Ensure the assets are correlated.
Signal Settings: Adjust the lookback period, ATR period, and signal sensitivity (Low/Medium/High) to control the frequency of signals.
OTE Settings: Choose the Fibonacci level for OTE zones (default: 61.8%).
Visual Settings: Enable/disable OTE zones, SMT labels, and debug labels for troubleshooting.
Interpreting Signals:
Blue Circles: Indicate a liquidity grab (price breaking a 5m or 15m pivot high/low), marking the start of a potential setup.
Blue OTE Zones: Appear after a liquidity grab, showing the retracement area (e.g., 61.8% Fibonacci level) where price is likely to enter for a reversal trade. The label "OTE Trigger 5m/15m" confirms the direction (Short/Long) and session.
Green/Red Entry Boxes: Mark precise entry points when price enters the OTE zone and confirms the SMT Divergence. Green boxes indicate a long entry, red boxes a short entry.
Trading Example:
On a 1m chart, a blue circle appears when price breaks a 5m pivot high during the London session.
A blue OTE zone forms, showing a retracement area (e.g., 61.8% Fibonacci level) with the label "OTE Trigger 5m/15m (Short, London)".
Price retraces into the OTE zone, and a red "Short Entry" box appears, confirming a bearish SMT Divergence.
Enter a short trade at the red box, with a stop-loss above the OTE zone and a take-profit at the next support level.
Originality and Utility
The SMT SwiftEdge Powerhouse stands out by merging SMT Divergence, Liquidity Grabs, and OTE Zones into a single, session-focused indicator. Unlike traditional indicators that focus on one aspect of price action, this script combines institutional reversal signals with precise entry zones, tailored to the most active market hours. Its adaptability across timeframes, customizable settings, and clear visual cues make it a versatile tool for traders seeking to capitalize on smart money movements with confidence.
Tips for Best Results
Use on correlated assets like NQ1! (Nasdaq futures) and ES1! (S&P 500 futures) for accurate SMT Divergence.
Test on lower timeframes (1m, 5m) for scalping or higher timeframes (15m, 1H) for swing trading.
Adjust the "Signal Sensitivity" to "High" for more signals or "Low" for fewer, high-quality setups.
Enable "Show Debug Labels" if signals are not appearing as expected, to troubleshoot pivot points and liquidity grabs.

Daily LevelsOverview:
The Daily Levels indicator plots key price levels from the previous trading day, including the high, low, median (pivot), and projected extensions. These levels help traders identify potential support/resistance zones and anticipate breakout or reversal opportunities.
Key Features:
✅ Previous Day High & Low – Visualizes the prior day’s high and low as dynamic support/resistance levels.
✅ Median (Pivot) Line – Calculates the midpoint between the previous day’s high and low, acting as a key intraday reference.
✅ Projected Levels – Extends the high/low range symmetrically above and below the median, highlighting potential breakout zones.
✅ Customizable Display – Toggle visibility, adjust colors, and modify line styles (solid, dotted, dashed).
✅ Price Labels – Clear on-chart labels showing exact price values for quick reference.
✅ Built-in Alerts – Get notified when price crosses any of the key levels.
How to Use:
Trend Identification: If price holds above the median, the bias is bullish; below suggests bearish momentum.
Breakout Trading: Watch for moves beyond the projected levels for potential continuation.
Mean Reversion: Fade moves toward the previous day’s high/low if the median holds as support/resistance.
Ideal For:
Day Traders – Intraday support/resistance levels.
Swing Traders – Context for multi-day trends.
Breakout/Reversal Strategies – Clear levels for trade triggers.
Settings Recommendations:
High/Low Lines: Use semi-transparent colors (e.g., green/red) for clarity.
Projections: Helpful for anticipating extended moves (e.g., teal for upper, orange for lower).
Alerts: Enable notifications for key crosses (e.g., median or high/low breaks).

Chonky ATR Levels 2.0Show ATR based high/low projections.
Choose a custom ATR calculation in the indicator's settings.
The default is a 20day RMA based ATR.
----------How projections are calculated----------
To project the ATR High, the ATR value is added to the low of the current candle that matches the ATR's timeframe.
To project the ATR Low, the ATR value is subtracted from the high of the current candle that matches the ATR's timeframe.
Example:
If a 20day RMA ATR is used:
- the ATR High will be the current day's low + the ATR value.
- the ATR Low will be the current day's high - the ATR value.
*However*, if the price action exceeds either ATR projection, the opposite ATR level will be fixed to the extreme of the period.
See the AUDUSD screenshot above for an example.
The ATR Low was exceeded, so the ATR High projection is capped at the high of day.
If the ATR High is exceeded, the ATR Low would be capped at the low of day.

02 SMC + BB Breakout (Improved)This strategy combines Smart Money Concepts (SMC) with Bollinger Band breakouts to identify potential trading opportunities. SMC focuses on identifying key price levels and market structure shifts, while Bollinger Bands help pinpoint overbought/oversold conditions and potential breakout points. The strategy also incorporates higher timeframe trend confirmation to filter out trades that go against the prevailing trend.
Key Components:
Bollinger Bands:
Calculated using a Simple Moving Average (SMA) of the closing price and a standard deviation multiplier.
The strategy uses the upper and lower bands to identify potential breakout points.
The SMA (basis) acts as a centerline and potential support/resistance level.
The fill between the upper and lower bands can be toggled by the user.
Higher Timeframe Trend Confirmation:
The strategy allows for optional confirmation of the current trend using a higher timeframe (e.g., daily).
It calculates the SMA of the higher timeframe's closing prices.
A bullish trend is confirmed if the higher timeframe's closing price is above its SMA.
This helps filter out trades that go against the prevailing long-term trend.
Smart Money Concepts (SMC):
Order Blocks:
Simplified as recent price clusters, identified by the highest high and lowest low over a specified lookback period.
These levels are considered potential areas of support or resistance.
Liquidity Zones (Swing Highs/Lows):
Identified by recent swing highs and lows, indicating areas where liquidity may be present.
The Swing highs and lows are calculated based on user defined lookback periods.
Market Structure Shift (MSS):
Identifies potential changes in market structure.
A bullish MSS occurs when the closing price breaks above a previous swing high.
A bearish MSS occurs when the closing price breaks below a previous swing low.
The swing high and low values used for the MSS are calculated based on the user defined swing length.
Entry Conditions:
Long Entry:
The closing price crosses above the upper Bollinger Band.
If higher timeframe confirmation is enabled, the higher timeframe trend must be bullish.
A bullish MSS must have occurred.
Short Entry:
The closing price crosses below the lower Bollinger Band.
If higher timeframe confirmation is enabled, the higher timeframe trend must be bearish.
A bearish MSS must have occurred.
Exit Conditions:
Long Exit:
The closing price crosses below the Bollinger Band basis.
Or the Closing price falls below 99% of the order block low.
Short Exit:
The closing price crosses above the Bollinger Band basis.
Or the closing price rises above 101% of the order block high.
Position Sizing:
The strategy calculates the position size based on a fixed percentage (5%) of the strategy's equity.
This helps manage risk by limiting the potential loss per trade.
Visualizations:
Bollinger Bands (upper, lower, and basis) are plotted on the chart.
SMC elements (order blocks, swing highs/lows) are plotted as lines, with user-adjustable visibility.
Entry and exit signals are plotted as shapes on the chart.
The Bollinger band fill opacity is adjustable by the user.
Trading Logic:
The strategy aims to capitalize on Bollinger Band breakouts that are confirmed by SMC signals and higher timeframe trend. It looks for breakouts that align with potential market structure shifts and key price levels (order blocks, swing highs/lows). The higher timeframe filter helps avoid trades that go against the overall trend.
In essence, the strategy attempts to identify high-probability breakout trades by combining momentum (Bollinger Bands) with structural analysis (SMC) and trend confirmation.
Key User-Adjustable Parameters:
Bollinger Bands Length
Standard Deviation Multiplier
Higher Timeframe
Higher Timeframe Confirmation (on/off)
SMC Elements Visibility (on/off)
Order block lookback length.
Swing lookback length.
Bollinger band fill opacity.
This detailed description should provide a comprehensive understanding of the strategy's logic and components.
***DISCLAIMER: This strategy is for educational purposes only. It is not financial advice. Past performance is not indicative of future results. Use at your own risk. Always perform thorough backtesting and forward testing before using any strategy in live trading.***

ICT Order Blocks v2 (Debug)Josh has a very large PP xD
Understanding Order Blocks (OBs) - The ICT Perspective
This document delves into the concept of Order Blocks (OBs) from the perspective of the ICT methodology. It outlines what OBs are, their significance in trading, and how the "ICT Order Blocks v2 (Refined)" indicator functions to identify and visualize these critical price levels. By understanding OBs, traders can better navigate market movements and make informed decisions based on institutional trading behavior.
What is an Order Block (OB)?
Within ICT methodology, an Order Block represents a specific price candle where significant buying or selling interest from institutions (Smart Money) is believed to have occurred. They are potential areas where price might return and react.
Bullish Order Block: Typically the last down-closing candle before a strong, impulsive upward move (displacement). It suggests institutions may have absorbed selling pressure and initiated long positions here.
Bearish Order Block: Typically the last up-closing candle before a strong, impulsive downward move (displacement). It suggests institutions may have distributed long positions or initiated short positions here.
Why are OBs Significant (ICT View)?
Institutional Footprint: They mark potential zones of large order execution.
Support/Resistance: Unmitigated OBs can act as sensitive price levels where reactions are expected. Bullish OBs may provide support; Bearish OBs may provide resistance.
Origin of Moves: They often mark the origin point of significant price swings.
Liquidity Engineering: Institutions might drive price back to OBs to mitigate earlier positions or to engineer liquidity before continuing a move.
Common Refinements
ICT often emphasizes higher probability OBs that are associated with:
Displacement: The move away from the OB is sharp and decisive.
Fair Value Gaps (FVGs): An FVG forming immediately after the OB strengthens its validity.
OB Mitigation: This refers to price returning to the level of the Order Block after its formation. Price might react at the edge (proximal line) or the 50% level (mean threshold) of the OB. An OB is often considered fully mitigated or invalidated if price trades decisively through its entire range, especially with a candle body closing beyond it.
How the "ICT Order Blocks v2 (Refined)" Indicator Works
This indicator automates the detection and visualization of the most recent unmitigated Order Block of each type (Bullish/Bearish), incorporating optional filters.
Detection:
It looks at the relationship between the candle two bars ago ( ), the previous candle ( ), and potentially the current candle ( ).
Bullish OB: Identifies if candle was a down-close (close < open ) AND candle broke above the high of candle (high > high ).
Bearish OB: Identifies if candle was an up-close (close > open ) AND candle broke below the low of candle (low < low ).
Accuracy Filters (Optional Inputs):
These filters help identify potentially higher-probability OBs:
Require Fair Value Gap (FVG)?: If enabled, the indicator checks if an FVG formed immediately after the OB candle ( ). Specifically, it looks for a gap between candle and candle (low > high for Bullish OB confirmation, high < low for Bearish).
Require Strong Close Breakout?: If enabled, it requires the breakout candle ( ) to close beyond the range of the OB candle ( ). (close > high for Bullish, close < low for Bearish). This suggests stronger confirmation.
Storing the Most Recent OB:
When an OB is detected and passes any enabled filters, its details (high, low, formation bar index) are stored. Crucially, this indicator only tracks the single most recent valid unmitigated OB of each type (one Bullish, one Bearish) using var variables. If a newer valid OB forms, it replaces the previously stored one.
Drawing Boxes:
If a valid Bullish OB is being tracked (and Show Bullish OBs is enabled), it draws a box (box.new) using the high and low of the identified OB candle ( ). The same process applies to Bearish OBs (Show Bearish OBs enabled). The boxes automatically extend to the right (extend.right) and their right edge is updated on each new bar (box.set_right) until they are mitigated. Labels ("Bull OB" / "Bear OB") are displayed inside the boxes.
Mitigation & Box Deletion:
The indicator checks if the current closing price (close ) has moved entirely beyond the range of the tracked OB.
Mitigation Rule Used: A Bullish OB is considered mitigated if close < bull_ob_low. A Bearish OB is considered mitigated if close > bear_ob_high. Once an OB is marked as mitigated, the indicator stops tracking it and its corresponding box is automatically deleted (box.delete) from the chart.
This indicator provides a dynamic visualization of the most recent, potentially significant Order Blocks that meet the specified criteria, helping traders identify key areas of interest based on ICT principles.

ICT FVG & Swing Detector Basic by Trader RiazICT FVG & Swing Detector Basic by Trader Riaz
Unlock Precision Trading with the Ultimate Fair Value Gap (FVG) and Swing Detection Tool!
Developed by Trader Riaz , the ICT FVG and Swing Detector Basic is a powerful Pine Script indicator designed to help traders identify key market structures with ease. Whether you're a day trader, swing trader, or scalper, this indicator provides actionable insights by detecting Bullish and Bearish Fair Value Gaps (FVGs) and Swing Highs/Lows on any timeframe. Perfect for trading forex, stocks, crypto, and more on TradingView!
Key Features:
1: Bullish and Bearish FVG Detection
- Automatically identifies Bullish FVGs (highlighted in green) and Bearish FVGs (highlighted in red) to spot potential reversal or continuation zones.
- Displays FVGs as shaded boxes with a dashed midline at 70% opacity, making it easy to see the midpoint of the gap for precise entries and exits.
- Labels are placed inside the FVG boxes at the extreme right for clear visibility.
2: Customizable FVG Display
- Control the number of Bullish and Bearish FVGs displayed on the chart with user-defined inputs (fvg_bull_count and fvg_bear_count).
- Toggle the visibility of Bullish and Bearish FVGs with simple checkboxes (show_bull_fvg and show_bear_fvg) to declutter your chart.
3: Swing High and Swing Low Detection
- Detects Swing Highs (blue lines) and Swing Lows (red lines) to identify key market turning points.
- Labels are positioned at the extreme right edge of the lines for better readability and alignment.
- Customize the number of Swing Highs and Lows displayed (swing_high_count and swing_low_count) to focus on the most recent market structures.
4: Fully Customizable Display
- Toggle visibility for Swing Highs and Lows (show_swing_high and show_swing_low) to suit your trading style.
- Adjust the colors of Swing High and Low lines (swing_high_color and swing_low_color) to match your chart preferences.
5: Clean and Efficient Design
- Built with Pine Script v6 for optimal performance on TradingView.
- Automatically removes older FVGs and Swing points when the user-defined count is exceeded, keeping your chart clean and focused.
- Labels are strategically placed to avoid clutter while providing clear information.
Why Use This Indicator?
Precision Trading: Identify high-probability setups with FVGs and Swing points, commonly used in Smart Money Concepts (SMC) and Institutional Trading strategies.
User-Friendly: Easy-to-use inputs allow traders of all levels to customize the indicator to their needs.
Versatile: Works on any market (Forex, Stocks, Crypto, Commodities) and timeframe (1M, 5M, 1H, 4H, Daily, etc.).
Developed by Trader Riaz: Backed by the expertise of Trader Riaz, a seasoned trader dedicated to creating tools that empower the TradingView community.
How to Use:
- Add the Custom FVG and Swing Detector to your chart on TradingView.
- Adjust the input settings to control the number of FVGs and Swing points displayed.
- Toggle visibility for Bullish/Bearish FVGs and Swing Highs/Lows as needed.
- Use the identified FVGs and Swing points to plan your trades, set stop-losses, and target key levels.
Ideal For:
- Traders using Smart Money Concepts (SMC), Price Action, or Market Structure strategies.
- Those looking to identify liquidity grabs, imbalances, and trend reversals.
- Beginners and advanced traders seeking a reliable tool to enhance their technical analysis.
Happy trading!

PowerZone Trading StrategyExplanation of the PowerZone Trading Strategy for Your Users
The PowerZone Trading Strategy is an automated trading strategy that detects strong price movements (called "PowerZones") and generates signals to enter a long (buy) or short (sell) position, complete with predefined take profit and stop loss levels. Here’s how it works, step by step:
1. What is a PowerZone?
A "PowerZone" (PZ) is a zone on the chart where the price has shown a significant and consistent movement over a specific number of candles (bars). There are two types:
Bullish PowerZone (Bullish PZ): Occurs when the price rises consistently over several candles after an initial bearish candle.
Bearish PowerZone (Bearish PZ): Occurs when the price falls consistently over several candles after an initial bullish candle.
The code analyzes:
A set number of candles (e.g., 5, adjustable via "Periods").
A minimum percentage move (adjustable via "Min % Move for PowerZone") to qualify as a strong zone.
Whether to use the full candle range (highs and lows) or just open/close prices (toggle with "Use Full Range ").
2. How Does It Detect PowerZones?
Bullish PowerZone:
Looks for an initial bearish candle (close below open).
Checks that the next candles (e.g., 5) are all bullish (close above open).
Ensures the total price movement exceeds the minimum percentage set.
Defines a range: from the high (or open) to the low of the initial candle.
Bearish PowerZone:
Looks for an initial bullish candle (close above open).
Checks that the next candles are all bearish (close below open).
Ensures the total price movement exceeds the minimum percentage.
Defines a range: from the high to the low (or close) of the initial candle.
These zones are drawn on the chart with lines: green or white for bullish, red or blue for bearish, depending on the color scheme ("DARK" or "BRIGHT").
3. When Does It Enter a Trade?
The strategy waits for a breakout from the PowerZone range to enter a trade:
Buy (Long): When the price breaks above the high of a Bullish PowerZone.
Sell (Short): When the price breaks below the low of a Bearish PowerZone.
The position size is set to 100% of available equity (adjustable in the code).
4. Take Profit and Stop Loss
Take Profit (TP): Calculated as a multiple (adjustable via "Take Profit Factor," default 1.5) of the PowerZone height. For example:
For a buy, TP = Entry price + (PZ height × 1.5).
For a sell, TP = Entry price - (PZ height × 1.5).
Stop Loss (SL): Calculated as a multiple (adjustable via "Stop Loss Factor," default 1.0) of the PZ height, placed below the range for buys or above for sells.
5. Visualization on the Chart
PowerZones are displayed with lines on the chart (you can hide them with "Show Bullish Channel" or "Show Bearish Channel").
An optional info panel ("Show Info Panel") displays key levels: PZ high and low, TP, and SL.
You can also enable brief documentation on the chart ("Show Documentation") explaining the basic rules.
6. Alerts
The code generates automatic alerts in TradingView:
For a bullish breakout: "Bullish PowerZone Breakout - LONG!"
For a bearish breakdown: "Bearish PowerZone Breakdown - SHORT!"
7. Customization
You can tweak:
The number of candles to detect a PZ ("Periods").
The minimum percentage move ("Min % Move").
Whether to use highs/lows or just open/close ("Use Full Range").
The TP and SL factors.
The color scheme and what elements to display on the chart.
Practical Example
Imagine you set "Periods = 5" and "Min % Move = 2%":
An initial bearish candle appears, followed by 5 consecutive bullish candles.
The total move exceeds 2%.
A Bullish PowerZone is drawn with a high and low.
If the price breaks above the high, you enter a long position with a TP 1.5 times the PZ height and an SL equal to the height below.
The system executes the trade and exits automatically at TP or SL.
Conclusion
This strategy is great for capturing strong price movements after consolidation or momentum zones. It’s automated, visual, and customizable, making it useful for both beginner and advanced traders. Try it out and adjust it to fit your trading style!

real_time_candlesIntroduction
The Real-Time Candles Library provides comprehensive tools for creating, manipulating, and visualizing custom timeframe candles in Pine Script. Unlike standard indicators that only update at bar close, this library enables real-time visualization of price action and indicators within the current bar, offering traders unprecedented insight into market dynamics as they unfold.
This library addresses a fundamental limitation in traditional technical analysis: the inability to see how indicators evolve between bar closes. By implementing sophisticated real-time data processing techniques, traders can now observe indicator movements, divergences, and trend changes as they develop, potentially identifying trading opportunities much earlier than with conventional approaches.
Key Features
The library supports two primary candle generation approaches:
Chart-Time Candles: Generate real-time OHLC data for any variable (like RSI, MACD, etc.) while maintaining synchronization with chart bars.
Custom Timeframe (CTF) Candles: Create candles with custom time intervals or tick counts completely independent of the chart's native timeframe.
Both approaches support traditional candlestick and Heikin-Ashi visualization styles, with options for moving average overlays to smooth the data.
Configuration Requirements
For optimal performance with this library:
Set max_bars_back = 5000 in your script settings
When using CTF drawing functions, set max_lines_count = 500, max_boxes_count = 500, and max_labels_count = 500
These settings ensure that you will be able to draw correctly and will avoid any runtime errors.
Usage Examples
Basic Chart-Time Candle Visualization
// Create real-time candles for RSI
float rsi = ta.rsi(close, 14)
Candle rsi_candle = candle_series(rsi, CandleType.candlestick)
// Plot the candles using Pine's built-in function
plotcandle(rsi_candle.Open, rsi_candle.High, rsi_candle.Low, rsi_candle.Close,
"RSI Candles", rsi_candle.candle_color, rsi_candle.candle_color)
Multiple Access Patterns
The library provides three ways to access candle data, accommodating different programming styles:
// 1. Array-based access for collection operations
Candle candles = candle_array(source)
// 2. Object-oriented access for single entity manipulation
Candle candle = candle_series(source)
float value = candle.source(Source.HLC3)
// 3. Tuple-based access for functional programming styles
= candle_tuple(source)
Custom Timeframe Examples
// Create 20-second candles with EMA overlay
plot_ctf_candles(
source = close,
candle_type = CandleType.candlestick,
sample_type = SampleType.Time,
number_of_seconds = 20,
timezone = -5,
tied_open = true,
ema_period = 9,
enable_ema = true
)
// Create tick-based candles (new candle every 15 ticks)
plot_ctf_tick_candles(
source = close,
candle_type = CandleType.heikin_ashi,
number_of_ticks = 15,
timezone = -5,
tied_open = true
)
Advanced Usage with Custom Visualization
// Get custom timeframe candles without automatic plotting
CandleCTF my_candles = ctf_candles_array(
source = close,
candle_type = CandleType.candlestick,
sample_type = SampleType.Time,
number_of_seconds = 30
)
// Apply custom logic to the candles
float ema_values = my_candles.ctf_ema(14)
// Draw candles and EMA using time-based coordinates
my_candles.draw_ctf_candles_time()
ema_values.draw_ctf_line_time(line_color = #FF6D00)
Library Components
Data Types
Candle: Structure representing chart-time candles with OHLC, polarity, and visualization properties
CandleCTF: Extended candle structure with additional time metadata for custom timeframes
TickData: Structure for individual price updates with time deltas
Enumerations
CandleType: Specifies visualization style (candlestick or Heikin-Ashi)
Source: Defines price components for calculations (Open, High, Low, Close, HL2, etc.)
SampleType: Sets sampling method (Time-based or Tick-based)
Core Functions
get_tick(): Captures current price as a tick data point
candle_array(): Creates an array of candles from price updates
candle_series(): Provides a single candle based on latest data
candle_tuple(): Returns OHLC values as a tuple
ctf_candles_array(): Creates custom timeframe candles without rendering
Visualization Functions
source(): Extracts specific price components from candles
candle_ctf_to_float(): Converts candle data to float arrays
ctf_ema(): Calculates exponential moving averages for candle arrays
draw_ctf_candles_time(): Renders candles using time coordinates
draw_ctf_candles_index(): Renders candles using bar index coordinates
draw_ctf_line_time(): Renders lines using time coordinates
draw_ctf_line_index(): Renders lines using bar index coordinates
Technical Implementation Notes
This library leverages Pine Script's varip variables for state management, creating a sophisticated real-time data processing system. The implementation includes:
Efficient tick capturing: Samples price at every execution, maintaining temporal tracking with time deltas
Smart state management: Uses a hybrid approach with mutable updates at index 0 and historical preservation at index 1+
Temporal synchronization: Manages two time domains (chart time and custom timeframe)
The tooltip implementation provides crucial temporal context for custom timeframe visualizations, allowing users to understand exactly when each candle formed regardless of chart timeframe.
Limitations
Custom timeframe candles cannot be backtested due to Pine Script's limitations with historical tick data
Real-time visualization is only available during live chart updates
Maximum history is constrained by Pine Script's array size limits
Applications
Indicator visualization: See how RSI, MACD, or other indicators evolve in real-time
Volume analysis: Create custom volume profiles independent of chart timeframe
Scalping strategies: Identify short-term patterns with precisely defined time windows
Volatility measurement: Track price movement characteristics within bars
Custom signal generation: Create entry/exit signals based on custom timeframe patterns
Conclusion
The Real-Time Candles Library bridges the gap between traditional technical analysis (based on discrete OHLC bars) and the continuous nature of market movement. By making indicators more responsive to real-time price action, it gives traders a significant edge in timing and decision-making, particularly in fast-moving markets where waiting for bar close could mean missing important opportunities.
Whether you're building custom indicators, researching price patterns, or developing trading strategies, this library provides the foundation for sophisticated real-time analysis in Pine Script.
Implementation Details & Advanced Guide
Core Implementation Concepts
The Real-Time Candles Library implements a sophisticated event-driven architecture within Pine Script's constraints. At its heart, the library creates what's essentially a reactive programming framework handling continuous data streams.
Tick Processing System
The foundation of the library is the get_tick() function, which captures price updates as they occur:
export get_tick(series float source = close, series float na_replace = na)=>
varip float price = na
varip int series_index = -1
varip int old_time = 0
varip int new_time = na
varip float time_delta = 0
// ...
This function:
Samples the current price
Calculates time elapsed since last update
Maintains a sequential index to track updates
The resulting TickData structure serves as the fundamental building block for all candle generation.
State Management Architecture
The library employs a sophisticated state management system using varip variables, which persist across executions within the same bar. This creates a hybrid programming paradigm that's different from standard Pine Script's bar-by-bar model.
For chart-time candles, the core state transition logic is:
// Real-time update of current candle
candle_data := Candle.new(Open, High, Low, Close, polarity, series_index, candle_color)
candles.set(0, candle_data)
// When a new bar starts, preserve the previous candle
if clear_state
candles.insert(1, candle_data)
price.clear()
// Reset state for new candle
Open := Close
price.push(Open)
series_index += 1
This pattern of updating index 0 in real-time while inserting completed candles at index 1 creates an elegant solution for maintaining both current state and historical data.
Custom Timeframe Implementation
The custom timeframe system manages its own time boundaries independent of chart bars:
bool clear_state = switch settings.sample_type
SampleType.Ticks => cumulative_series_idx >= settings.number_of_ticks
SampleType.Time => cumulative_time_delta >= settings.number_of_seconds
This dual-clock system synchronizes two time domains:
Pine's execution clock (bar-by-bar processing)
The custom timeframe clock (tick or time-based)
The library carefully handles temporal discontinuities, ensuring candle formation remains accurate despite irregular tick arrival or market gaps.
Advanced Usage Techniques
1. Creating Custom Indicators with Real-Time Candles
To develop indicators that process real-time data within the current bar:
// Get real-time candles for your data
Candle rsi_candles = candle_array(ta.rsi(close, 14))
// Calculate indicator values based on candle properties
float signal = ta.ema(rsi_candles.first().source(Source.Close), 9)
// Detect patterns that occur within the bar
bool divergence = close > close and rsi_candles.first().Close < rsi_candles.get(1).Close
2. Working with Custom Timeframes and Plotting
For maximum flexibility when visualizing custom timeframe data:
// Create custom timeframe candles
CandleCTF volume_candles = ctf_candles_array(
source = volume,
candle_type = CandleType.candlestick,
sample_type = SampleType.Time,
number_of_seconds = 60
)
// Convert specific candle properties to float arrays
float volume_closes = volume_candles.candle_ctf_to_float(Source.Close)
// Calculate derived values
float volume_ema = volume_candles.ctf_ema(14)
// Create custom visualization
volume_candles.draw_ctf_candles_time()
volume_ema.draw_ctf_line_time(line_color = color.orange)
3. Creating Hybrid Timeframe Analysis
One powerful application is comparing indicators across multiple timeframes:
// Standard chart timeframe RSI
float chart_rsi = ta.rsi(close, 14)
// Custom 5-second timeframe RSI
CandleCTF ctf_candles = ctf_candles_array(
source = close,
candle_type = CandleType.candlestick,
sample_type = SampleType.Time,
number_of_seconds = 5
)
float fast_rsi_array = ctf_candles.candle_ctf_to_float(Source.Close)
float fast_rsi = fast_rsi_array.first()
// Generate signals based on divergence between timeframes
bool entry_signal = chart_rsi < 30 and fast_rsi > fast_rsi_array.get(1)
Final Notes
This library represents an advanced implementation of real-time data processing within Pine Script's constraints. By creating a reactive programming framework for handling continuous data streams, it enables sophisticated analysis typically only available in dedicated trading platforms.
The design principles employed—including state management, temporal processing, and object-oriented architecture—can serve as patterns for other advanced Pine Script development beyond this specific application.
------------------------
Library "real_time_candles"
A comprehensive library for creating real-time candles with customizable timeframes and sampling methods.
Supports both chart-time and custom-time candles with options for candlestick and Heikin-Ashi visualization.
Allows for tick-based or time-based sampling with moving average overlay capabilities.
get_tick(source, na_replace)
Captures the current price as a tick data point
Parameters:
source (float) : Optional - Price source to sample (defaults to close)
na_replace (float) : Optional - Value to use when source is na
Returns: TickData structure containing price, time since last update, and sequential index
candle_array(source, candle_type, sync_start, bullish_color, bearish_color)
Creates an array of candles based on price updates
Parameters:
source (float) : Optional - Price source to sample (defaults to close)
candle_type (simple CandleType) : Optional - Type of candle chart to create (candlestick or Heikin-Ashi)
sync_start (simple bool) : Optional - Whether to synchronize with the start of a new bar
bullish_color (color) : Optional - Color for bullish candles
bearish_color (color) : Optional - Color for bearish candles
Returns: Array of Candle objects ordered with most recent at index 0
candle_series(source, candle_type, wait_for_sync, bullish_color, bearish_color)
Provides a single candle based on the latest price data
Parameters:
source (float) : Optional - Price source to sample (defaults to close)
candle_type (simple CandleType) : Optional - Type of candle chart to create (candlestick or Heikin-Ashi)
wait_for_sync (simple bool) : Optional - Whether to wait for a new bar before starting
bullish_color (color) : Optional - Color for bullish candles
bearish_color (color) : Optional - Color for bearish candles
Returns: A single Candle object representing the current state
candle_tuple(source, candle_type, wait_for_sync, bullish_color, bearish_color)
Provides candle data as a tuple of OHLC values
Parameters:
source (float) : Optional - Price source to sample (defaults to close)
candle_type (simple CandleType) : Optional - Type of candle chart to create (candlestick or Heikin-Ashi)
wait_for_sync (simple bool) : Optional - Whether to wait for a new bar before starting
bullish_color (color) : Optional - Color for bullish candles
bearish_color (color) : Optional - Color for bearish candles
Returns: Tuple representing current candle values
method source(self, source, na_replace)
Extracts a specific price component from a Candle
Namespace types: Candle
Parameters:
self (Candle)
source (series Source) : Type of price data to extract (Open, High, Low, Close, or composite values)
na_replace (float) : Optional - Value to use when source value is na
Returns: The requested price value from the candle
method source(self, source)
Extracts a specific price component from a CandleCTF
Namespace types: CandleCTF
Parameters:
self (CandleCTF)
source (simple Source) : Type of price data to extract (Open, High, Low, Close, or composite values)
Returns: The requested price value from the candle as a varip
method candle_ctf_to_float(self, source)
Converts a specific price component from each CandleCTF to a float array
Namespace types: array
Parameters:
self (array)
source (simple Source) : Optional - Type of price data to extract (defaults to Close)
Returns: Array of float values extracted from the candles, ordered with most recent at index 0
method ctf_ema(self, ema_period)
Calculates an Exponential Moving Average for a CandleCTF array
Namespace types: array
Parameters:
self (array)
ema_period (simple float) : Period for the EMA calculation
Returns: Array of float values representing the EMA of the candle data, ordered with most recent at index 0
method draw_ctf_candles_time(self, sample_type, number_of_ticks, number_of_seconds, timezone)
Renders custom timeframe candles using bar time coordinates
Namespace types: array
Parameters:
self (array)
sample_type (simple SampleType) : Optional - Method for sampling data (Time or Ticks), used for tooltips
number_of_ticks (simple int) : Optional - Number of ticks per candle (used when sample_type is Ticks), used for tooltips
number_of_seconds (simple float) : Optional - Time duration per candle in seconds (used when sample_type is Time), used for tooltips
timezone (simple int) : Optional - Timezone offset from UTC (-12 to +12), used for tooltips
Returns: void - Renders candles on the chart using time-based x-coordinates
method draw_ctf_candles_index(self, sample_type, number_of_ticks, number_of_seconds, timezone)
Renders custom timeframe candles using bar index coordinates
Namespace types: array
Parameters:
self (array)
sample_type (simple SampleType) : Optional - Method for sampling data (Time or Ticks), used for tooltips
number_of_ticks (simple int) : Optional - Number of ticks per candle (used when sample_type is Ticks), used for tooltips
number_of_seconds (simple float) : Optional - Time duration per candle in seconds (used when sample_type is Time), used for tooltips
timezone (simple int) : Optional - Timezone offset from UTC (-12 to +12), used for tooltips
Returns: void - Renders candles on the chart using index-based x-coordinates
method draw_ctf_line_time(self, source, line_size, line_color)
Renders a line representing a price component from the candles using time coordinates
Namespace types: array
Parameters:
self (array)
source (simple Source) : Optional - Type of price data to extract (defaults to Close)
line_size (simple int) : Optional - Width of the line
line_color (simple color) : Optional - Color of the line
Returns: void - Renders a connected line on the chart using time-based x-coordinates
method draw_ctf_line_time(self, line_size, line_color)
Renders a line from a varip float array using time coordinates
Namespace types: array
Parameters:
self (array)
line_size (simple int) : Optional - Width of the line, defaults to 2
line_color (simple color) : Optional - Color of the line
Returns: void - Renders a connected line on the chart using time-based x-coordinates
method draw_ctf_line_index(self, source, line_size, line_color)
Renders a line representing a price component from the candles using index coordinates
Namespace types: array
Parameters:
self (array)
source (simple Source) : Optional - Type of price data to extract (defaults to Close)
line_size (simple int) : Optional - Width of the line
line_color (simple color) : Optional - Color of the line
Returns: void - Renders a connected line on the chart using index-based x-coordinates
method draw_ctf_line_index(self, line_size, line_color)
Renders a line from a varip float array using index coordinates
Namespace types: array
Parameters:
self (array)
line_size (simple int) : Optional - Width of the line, defaults to 2
line_color (simple color) : Optional - Color of the line
Returns: void - Renders a connected line on the chart using index-based x-coordinates
plot_ctf_tick_candles(source, candle_type, number_of_ticks, timezone, tied_open, ema_period, bullish_color, bearish_color, line_width, ema_color, use_time_indexing)
Plots tick-based candles with moving average
Parameters:
source (float) : Input price source to sample
candle_type (simple CandleType) : Type of candle chart to display
number_of_ticks (simple int) : Number of ticks per candle
timezone (simple int) : Timezone offset from UTC (-12 to +12)
tied_open (simple bool) : Whether to tie open price to close of previous candle
ema_period (simple float) : Period for the exponential moving average
bullish_color (color) : Optional - Color for bullish candles
bearish_color (color) : Optional - Color for bearish candles
line_width (simple int) : Optional - Width of the moving average line, defaults to 2
ema_color (color) : Optional - Color of the moving average line
use_time_indexing (simple bool) : Optional - When true the function will plot with xloc.time, when false it will plot using xloc.bar_index
Returns: void - Creates visual candle chart with EMA overlay
plot_ctf_tick_candles(source, candle_type, number_of_ticks, timezone, tied_open, bullish_color, bearish_color, use_time_indexing)
Plots tick-based candles without moving average
Parameters:
source (float) : Input price source to sample
candle_type (simple CandleType) : Type of candle chart to display
number_of_ticks (simple int) : Number of ticks per candle
timezone (simple int) : Timezone offset from UTC (-12 to +12)
tied_open (simple bool) : Whether to tie open price to close of previous candle
bullish_color (color) : Optional - Color for bullish candles
bearish_color (color) : Optional - Color for bearish candles
use_time_indexing (simple bool) : Optional - When true the function will plot with xloc.time, when false it will plot using xloc.bar_index
Returns: void - Creates visual candle chart without moving average
plot_ctf_time_candles(source, candle_type, number_of_seconds, timezone, tied_open, ema_period, bullish_color, bearish_color, line_width, ema_color, use_time_indexing)
Plots time-based candles with moving average
Parameters:
source (float) : Input price source to sample
candle_type (simple CandleType) : Type of candle chart to display
number_of_seconds (simple float) : Time duration per candle in seconds
timezone (simple int) : Timezone offset from UTC (-12 to +12)
tied_open (simple bool) : Whether to tie open price to close of previous candle
ema_period (simple float) : Period for the exponential moving average
bullish_color (color) : Optional - Color for bullish candles
bearish_color (color) : Optional - Color for bearish candles
line_width (simple int) : Optional - Width of the moving average line, defaults to 2
ema_color (color) : Optional - Color of the moving average line
use_time_indexing (simple bool) : Optional - When true the function will plot with xloc.time, when false it will plot using xloc.bar_index
Returns: void - Creates visual candle chart with EMA overlay
plot_ctf_time_candles(source, candle_type, number_of_seconds, timezone, tied_open, bullish_color, bearish_color, use_time_indexing)
Plots time-based candles without moving average
Parameters:
source (float) : Input price source to sample
candle_type (simple CandleType) : Type of candle chart to display
number_of_seconds (simple float) : Time duration per candle in seconds
timezone (simple int) : Timezone offset from UTC (-12 to +12)
tied_open (simple bool) : Whether to tie open price to close of previous candle
bullish_color (color) : Optional - Color for bullish candles
bearish_color (color) : Optional - Color for bearish candles
use_time_indexing (simple bool) : Optional - When true the function will plot with xloc.time, when false it will plot using xloc.bar_index
Returns: void - Creates visual candle chart without moving average
plot_ctf_candles(source, candle_type, sample_type, number_of_ticks, number_of_seconds, timezone, tied_open, ema_period, bullish_color, bearish_color, enable_ema, line_width, ema_color, use_time_indexing)
Unified function for plotting candles with comprehensive options
Parameters:
source (float) : Input price source to sample
candle_type (simple CandleType) : Optional - Type of candle chart to display
sample_type (simple SampleType) : Optional - Method for sampling data (Time or Ticks)
number_of_ticks (simple int) : Optional - Number of ticks per candle (used when sample_type is Ticks)
number_of_seconds (simple float) : Optional - Time duration per candle in seconds (used when sample_type is Time)
timezone (simple int) : Optional - Timezone offset from UTC (-12 to +12)
tied_open (simple bool) : Optional - Whether to tie open price to close of previous candle
ema_period (simple float) : Optional - Period for the exponential moving average
bullish_color (color) : Optional - Color for bullish candles
bearish_color (color) : Optional - Color for bearish candles
enable_ema (bool) : Optional - Whether to display the EMA overlay
line_width (simple int) : Optional - Width of the moving average line, defaults to 2
ema_color (color) : Optional - Color of the moving average line
use_time_indexing (simple bool) : Optional - When true the function will plot with xloc.time, when false it will plot using xloc.bar_index
Returns: void - Creates visual candle chart with optional EMA overlay
ctf_candles_array(source, candle_type, sample_type, number_of_ticks, number_of_seconds, tied_open, bullish_color, bearish_color)
Creates an array of custom timeframe candles without rendering them
Parameters:
source (float) : Input price source to sample
candle_type (simple CandleType) : Type of candle chart to create (candlestick or Heikin-Ashi)
sample_type (simple SampleType) : Method for sampling data (Time or Ticks)
number_of_ticks (simple int) : Optional - Number of ticks per candle (used when sample_type is Ticks)
number_of_seconds (simple float) : Optional - Time duration per candle in seconds (used when sample_type is Time)
tied_open (simple bool) : Optional - Whether to tie open price to close of previous candle
bullish_color (color) : Optional - Color for bullish candles
bearish_color (color) : Optional - Color for bearish candles
Returns: Array of CandleCTF objects ordered with most recent at index 0
Candle
Structure representing a complete candle with price data and display properties
Fields:
Open (series float) : Opening price of the candle
High (series float) : Highest price of the candle
Low (series float) : Lowest price of the candle
Close (series float) : Closing price of the candle
polarity (series bool) : Boolean indicating if candle is bullish (true) or bearish (false)
series_index (series int) : Sequential index identifying the candle in the series
candle_color (series color) : Color to use when rendering the candle
ready (series bool) : Boolean indicating if candle data is valid and ready for use
TickData
Structure for storing individual price updates
Fields:
price (series float) : The price value at this tick
time_delta (series float) : Time elapsed since the previous tick in milliseconds
series_index (series int) : Sequential index identifying this tick
CandleCTF
Structure representing a custom timeframe candle with additional time metadata
Fields:
Open (series float) : Opening price of the candle
High (series float) : Highest price of the candle
Low (series float) : Lowest price of the candle
Close (series float) : Closing price of the candle
polarity (series bool) : Boolean indicating if candle is bullish (true) or bearish (false)
series_index (series int) : Sequential index identifying the candle in the series
open_time (series int) : Timestamp marking when the candle was opened (in Unix time)
time_delta (series float) : Duration of the candle in milliseconds
candle_color (series color) : Color to use when rendering the candle

MTF Ichimoku Conversion Line SMA with H/L mirrored levelsWelcome to MTF Ichimoku Conversion Line with SMA Highs/Lows Extended Lines!
1. Overview
It is designed to provide a multi-timeframe view of market trends and potential support/resistance levels by obtaining a Simple Moving Average (SMA) of the Conversion Line of Ichimoku Equibilium (Ichimoku Kinko-Hyo), which acts as a substantial trend line on the candlestick chart. The SMA of the conversion line smooths out price fluctuations and indicates the overall trend direction—if the candles are above it, the trend can be read as an uptrend, while below it, the trend can be read as a downtrend.
2. Calculation
The indicator first calculates the Conversion Line (see the description of Ichimoku theory anywhere, e.g., Wikipedia), as the average of the highest high and lowest low over a user-defined period (Conversion Line Length, default is 9, also recommended is 9).
It then retrieves this Conversion Line from a higher timeframe (MTF Timeframe) to add a broader perspective. Using a specified period (SMA Length)., an SMA is computed on this multi-timeframe conversion line. This SMA serves as a trend line that visually represents the prevailing price trend, making it easier to assess market direction.
3. Pivot Highs/low detection and drawing their extensions
In addition, the indicator identifies pivot highs and lows from the SMA data using a defined pivot length. When these pivots occur, horizontal lines are drawn and extended across the chart. These extended lines (drawn in a yellowish color by default) include a full extension, a half extension, and a middle extension line representing the midpoint between the high and low pivot.
4. Mirror lines
The indicator also offers optional mirror line features. When the Mirror Upside option is enabled, five additional lines are drawn above the highest extended yellow line at equal intervals. Similarly, when the Mirror Downside option is enabled, five lines are drawn below the lowest extended yellow line. These light gray mirror lines serve as extra reference levels, which can help identify potential support or resistance zones.
5. Parameters
User parameters include:
- Conversion Line Length: The period used to calculate the conversion line.
- MTF Timeframe: The higher timeframe from which the conversion line is obtained.
- SMA Length: The period over which the SMA is calculated on the conversion line.
- SMA Mode: A toggle to display either the SMA or the raw conversion line (SMA recommended).
- SMA Line Width: The thickness of the SMA line.
- Pivot Length for SMA Highs/Lows: The period used to detect pivot highs and lows in the SMA.
- Horizontal Extension: Number of bars by which the pivot and extended lines are drawn across the chart
- Colors for High and Low Pivot Lines and Extended Lines: Customizable colors are used to draw the lines.
Mirror Upside and Mirror Downside: These options enable drawing additional mirror lines above and below the extended lines.
- Hide Old Lines: An option to hide previous pivot lines once new ones are drawn for a cleaner chart. Turned on by default.
6. Conclusion
Overall, the Conversion Line SMA in this indicator smooths out the conversion line data and effectively functions as a trend line for the candlestick chart, helping traders visually interpret the underlying market trend. The extended and mirror lines provide further context for potential price reversal or continuation areas, making this a powerful tool for multi-timeframe technical analysis.

Opening Range, Initial Balance, Opening Price, Pre-market Levels### Description of the Indicator: **Opening Range, Initial Balance, Opening Price, Pre-market Levels**
This custom TradingView indicator provides a comprehensive view of key price levels for intraday trading, specifically designed to track important levels from the Opening Range (OR), Initial Balance (IB), Opening Price (OP), and Pre-market session (PM). These levels are essential for traders to gauge potential market movements and identify critical areas of support and resistance.
#### **Features:**
1. **Opening Range (OR):**
- This is the high and low of the first 30 minutes of the regular market session (09:30 - 10:00 EST).
- The OR high and low act as significant levels that may influence price movement for the rest of the day.
- The mid-level of the Opening Range (OR Mid) is also plotted to give a more detailed view of potential price action.
2. **Initial Balance (IB):**
- The Initial Balance is the range created during the first hour of market activity (09:30 - 10:30 EST).
- This range often sets the tone for the market's direction. The IB high and low, along with the IB midline, are plotted for quick reference.
3. **Opening Price (OP):**
- The opening price of the market is marked as a circle and labeled "OP."
- This level provides context for market sentiment when compared to the high and low levels.
4. **Pre-market Levels (PM):**
- The pre-market session (04:00 - 09:30 EST) has its own important levels that are calculated for the high, low, and mid range (PM High, PM Low, and PM Mid).
- These levels are plotted and are useful for traders to understand where the market stood before the regular session opened.
#### **Customization Options:**
- **Exchange Timezone:** You can choose whether to display the times in the exchange's local timezone or in your own preferred timezone.
- **Mid Levels Display:** You can toggle whether the mid levels for each range (OR, IB, PM) should be shown on the chart.
- **Level Color Change:** The colors of the plotted levels (high, low, mid) change based on whether the price is above or below the respective level, making it easy to visualize potential support and resistance.
- **Label Positions:** The position of the labels (OR, IB, OP, PM) on the chart can be customized to avoid overlap with other data points.
#### **Key Use Cases:**
- **Intraday Trend Analysis:** Use the OR and IB to identify key levels for the day, providing insights into the possible trend or range for the day.
- **Pre-market Insights:** The PM levels are crucial for understanding where the market stood during the pre-market hours and can be used as reference points during the regular session.
- **Potential Support and Resistance:** The high and low levels of the OR, IB, and PM sessions can act as potential support or resistance, which are useful for setting stop-loss and take-profit levels.
#### **How to Use:**
- Pay attention to the levels provided for OR, IB, and PM as potential entry and exit points.
- Watch for breakouts or reversals around these levels, especially when combined with other technical indicators or price action patterns.
- The mid levels offer an additional reference to assess price direction or identify possible areas of consolidation.
This indicator is perfect for day traders who rely on key intraday levels and pre-market activity to make informed trading decisions. It helps to streamline the process of identifying potential breakouts, reversals, and ranges in the market.
[GrandAlgo] MTF Historical Highs and LowsMany traders rely on weekly highs and lows to identify key market levels, but what if you could see how price reacted to these levels in past weeks, months, or even years? With MTF Historical Highs and Lows, you can visualize all past highs, lows, and midpoints from any timeframe, allowing you to refine your strategy and make more informed trading decisions.
This indicator retrieves and plots historical highs, lows, and midpoints based on a user-selected timeframe (default: Weekly). It dynamically updates, ensuring that all significant price levels remain visible on your chart. Additionally, smart filtering helps you focus only on relevant levels, and alerts notify you when price interacts with key zones.
Key Features:
✅ Automatically Fetches & Plots Historical Highs, Lows, and Midpoints
✅ Customizable Timeframes (default: Weekly, but adjustable)
✅ Visibility Filtering – Hides lines that are too far from the current price
✅ Alerts for Key Levels – Get notified when price touches an important historical level
✅ Customizable Colors & Display Preferences for clarity
How It Works:
1️⃣ Select a Date Range – Focus on historical levels that are most relevant to the current market conditions
2️⃣ Choose a Timeframe – Use Weekly, Monthly, or any timeframe that suits your strategy.
3️⃣ Enable Highs, Lows, and Midpoints – Customize what you want to see.
4️⃣ Adjust Filtering – Hide lines that are too far from the current price to reduce clutter.
5️⃣ Get Alerts – Be notified when price reaches a historical level for potential trade setups.
Ideal for Traders Who:
Trade Support & Resistance Levels – Understand how price reacts at historical highs and lows.
Analyze Market Structure – Identify key areas where price may reverse or break out.
Want Smart Alerts – Stay informed without staring at charts all day.

2022 Model ICT Entry Strategy [TradingFinder] One Setup For Life🔵 Introduction
The ICT 2022 model, introduced by Michael Huddleston, is an advanced trading strategy rooted in liquidity and price imbalance, where time and price serve as the core elements. This ICT 2022 trading strategy is an algorithmic approach designed to analyze liquidity and imbalances in the market. It incorporates concepts such as Fair Value Gap (FVG), Liquidity Sweep, and Market Structure Shift (MSS) to help traders identify liquidity movements and structural changes in the market, enabling them to determine optimal entry and exit points for their trades.
This Full ICT Day Trading Model empowers traders to pinpoint the Previous Day High/Low as well as the highs and lows of critical sessions like the London and New York sessions. These levels act as Liquidity Zones, which are frequently swept prior to a market structure shift (MSS) or a retracement to areas such as Optimal Trade Entry (OTE).
Bullish :
Bearish :
🔵 How to Use
The ICT 2022 model is a sophisticated trading strategy that focuses on identifying key liquidity levels and price movements. It operates based on two main principles. In the first phase, the price approaches liquidity zones and sweeps critical levels such as the previous day’s high or low and key session levels.
This movement is known as a Liquidity Sweep. In the second phase, following the sweep, the price retraces to areas like the FVG (Fair Value Gap), creating ideal entry points for trades. Below is a detailed explanation of how to apply this strategy in bullish and bearish setups.
🟣 Bullish ICT 2022 Model Setup
To use the ICT 2022 model in a bullish setup, start by identifying the Previous Day High/Low or key session levels, such as those of the London or New York sessions. In a bullish setup, the price usually moves downward first, sweeping the Liquidity Low. This move, known as a Liquidity Sweep, reflects the collection of buy orders by major market participants.
After the liquidity sweep, the price should shift market structure and start moving upward; this shift, referred to as Market Structure Shift (MSS), signals the beginning of an upward trend. Following MSS, areas like FVG, located within the Discount Zone, are identified. At this stage, the trader waits for the price to retrace to these zones. Once the price returns, a long trade is executed.
Finally, the stop-loss should be set below the liquidity low to manage risk, while the take-profit target is usually placed above the previous day’s high or other identified liquidity levels. This structure enables traders to take advantage of the upward price movement after the liquidity sweep.
🟣 Bearish ICT 2022 Model Setup
To identify a bearish setup in the ICT 2022 model, begin by marking the Previous Day High/Low or key session levels, such as the London or New York sessions. In this scenario, the price typically moves upward first, sweeping the Liquidity High. This move, known as a Liquidity Sweep, signifies the collection of sell orders by key market players.
After the liquidity sweep, the price should shift market structure downward. This movement, called the Market Structure Shift (MSS), indicates the start of a downtrend. Following MSS, areas such as FVG, found within the Premium Zone, are identified. At this stage, the trader waits for the price to retrace to these areas. Once the price revisits these zones, a short trade is executed.
In this setup, the stop-loss should be placed above the liquidity high to control risk, while the take-profit target is typically set below the previous day’s low or another defined liquidity level. This approach allows traders to capitalize on the downward price movement following the liquidity sweep.
🔵 Settings
Swing period : You can set the swing detection period.
Max Swing Back Method : It is in two modes "All" and "Custom". If it is in "All" mode, it will check all swings, and if it is in "Custom" mode, it will check the swings to the extent you determine.
Max Swing Back : You can set the number of swings that will go back for checking.
FVG Length : Default is 120 Bar.
MSS Length : Default is 80 Bar.
FVG Filter : This refines the number of identified FVG areas based on a specified algorithm to focus on higher quality signals and reduce noise.
Types of FVG filters :
Very Aggressive Filter: Adds a condition where, for an upward FVG, the last candle's highest price must exceed the middle candle's highest price, and for a downward FVG, the last candle's lowest price must be lower than the middle candle's lowest price. This minimally filters out FVGs.
Aggressive Filter: Builds on the Very Aggressive mode by ensuring the middle candle is not too small, filtering out more FVGs.
Defensive Filter: Adds criteria regarding the size and structure of the middle candle, requiring it to have a substantial body and specific polarity conditions, filtering out a significant number of FVGs.
Very Defensive Filter: Further refines filtering by ensuring the first and third candles are not small-bodied doji candles, retaining only the highest quality signals.
🔵 Conclusion
The ICT 2022 model is a comprehensive and advanced trading strategy designed around key concepts such as liquidity, price imbalance, and market structure shifts (MSS). By focusing on the sweep of critical levels such as the previous day’s high/low and important trading sessions like London and New York, this strategy enables traders to predict market movements with greater precision.
The use of tools like FVG in this model helps traders fine-tune their entry and exit points and take advantage of bullish and bearish trends after liquidity sweeps. Moreover, combining this strategy with precise timing during key trading sessions allows traders to minimize risk and maximize returns.
In conclusion, the ICT 2022 model emphasizes the importance of time and liquidity, making it a powerful tool for both professional and novice traders. By applying the principles of this model, you can make more informed trading decisions and seize opportunities in financial markets more effectively.

Uptrick: Fisher Eclipse1. Name and Purpose
Uptrick: Fisher Eclipse is a Pine version 6 extension of the basic Fisher Transform indicator that focuses on highlighting potential turning points in price data. Its purpose is to allow traders to spot shifts in momentum, detect divergence, and adapt signals to different market environments. By combining a core Fisher Transform with additional signal processing, divergence detection, and customizable aggressiveness settings, this script aims to help users see when a price move might be losing momentum or gaining strength.
2. Overview
This script uses a Fisher Transform calculation on the average of each bar’s high and low (hl2). The Fisher Transform is designed to amplify price extremes by mapping data into a different scale, making potential reversals more visible than they might be with standard oscillators. Uptrick: Fisher Eclipse takes this concept further by integrating a signal line, divergence detection, bar coloring for momentum intensity, and optional thresholds to reduce unwanted noise.
3. Why Use the Fisher Transform
The Fisher Transform is known for converting relatively smoothed price data into a more pronounced scale. This transformation highlights where markets may be overextended. In many cases, standard oscillators move gently, and traders can miss subtle hints that a reversal might be approaching. The Fisher Transform’s mathematical approach tightens the range of values and sharpens the highs and lows. This behavior can allow traders to see clearer peaks and troughs in momentum. Because it is often quite responsive, it can help anticipate areas where price might change direction, especially when compared to simpler moving averages or traditional oscillators. The result is a more evident signal of possible overbought or oversold conditions.
4. How This Extension Improves on the Basic Fisher Transform
Uptrick: Fisher Eclipse adds multiple features to the classic Fisher framework in order to address different trading styles and market behaviors:
a) Divergence Detection
The script can detect bullish or bearish divergences between price and the oscillator over a chosen lookback period, helping traders anticipate shifts in market direction.
b) Bar Coloring
When momentum exceeds a certain threshold (default 3), bars can be colored to highlight surges of buying or selling pressure. This quick visual reference can assist in spotting periods of heightened activity. After a bar color like this, usually, there is a quick correction as seen in the image below.
c) Signal Aggressiveness Levels
Users can choose between conservative, moderate, or aggressive signal thresholds. This allows them to tune how quickly the indicator flags potential entries or exits. Aggressive settings might suit scalpers who need rapid signals, while conservative settings may benefit swing traders preferring fewer, more robust indications.
d) Minimum Movement Filter
A configurable filter can be set to ensure that the Fisher line and its signal have a sufficient gap before triggering a buy or sell signal. This step is useful for traders seeking to minimize signals during choppy or sideways markets. This can be used to eliminate noise as well.
By combining all these elements into one package, the indicator attempts to offer a comprehensive toolkit for those who appreciate the Fisher Transform’s clarity but also desire more versatility.
5. Core Components
a) Fisher Transform
The script calculates a Fisher value using normalized price over a configurable length, highlighting potential peaks and troughs.
b) Signal Line
The Fisher line is smoothed using a short Simple Moving Average. Crossovers and crossunders are one of the key ways this indicator attempts to confirm momentum shifts.
c) Divergence Logic
The script looks back over a set number of bars to compare current highs and lows of both price and the Fisher oscillator. When price and the oscillator move in opposing directions, a divergence may occur, suggesting a possible upcoming reversal or weakening trend.
d) Thresholds for Overbought and Oversold
Horizontal lines are drawn at user-chosen overbought and oversold levels. These lines help traders see when momentum readings reach particular extremes, which can be especially relevant when combined with crossovers in that region.
e) Intensity Filter and Bar Coloring
If the magnitude of the change in the Fisher Transform meets or exceeds a specified threshold, bars are recolored. This provides a visual cue for significant momentum changes.
6. User Inputs
a) length
Defines how many bars the script looks back to compute the highest high and lowest low for the Fisher Transform. A smaller length reacts more quickly but can be noisier, while a larger length smooths out the indicator at the cost of responsiveness.
b) signal aggressiveness
Adjusts the buy and sell thresholds for conservative, moderate, and aggressive trading styles. This can be key in matching the indicator to personal risk preferences or varying market conditions. Conservative will give you less signals and aggressive will give you more signals.
c) minimum movement filter
Specifies how far apart the Fisher line and its signal line must be before generating a valid crossover signal.
d) divergence lookback
Controls how many bars are examined when determining if price and the oscillator are diverging. A larger setting might generate fewer signals, while a smaller one can provide more frequent alerts.
e) intensity threshold
Determines how large a change in the Fisher value must be for the indicator to recolor bars. Strong momentum surges become more noticeable.
f) overbought level and oversold level
Lets users define where they consider market conditions to be stretched on the upside or downside.
7. Calculation Process
a) Price Input
The script uses the midpoint of each bar’s high and low, sometimes referred to as hl2.
hl2 = (high + low) / 2
b) Range Normalization
Determine the maximum (maxHigh) and minimum (minLow) values over a user-defined lookback period (length).
Scale the hl2 value so it roughly fits between -1 and +1:
value = 2 * ((hl2 - minLow) / (maxHigh - minLow) - 0.5)
This step highlights the bar’s current position relative to its recent highs and lows.
c) Fisher Calculation
Convert the normalized value into the Fisher Transform:
fisher = 0.5 * ln( (1 + value) / (1 - value) ) + 0.5 * fisher_previous
fisher_previous is simply the Fisher value from the previous bar. Averaging half of the new transform with half of the old value smooths the result slightly and can prevent erratic jumps.
ln is the natural logarithm function, which compresses or expands values so that market turns often become more obvious.
d) Signal Smoothing
Once the Fisher value is computed, a short Simple Moving Average (SMA) is applied to produce a signal line. In code form, this often looks like:
signal = sma(fisher, 3)
Crossovers of the fisher line versus the signal line can be used to hint at changes in momentum:
• A crossover occurs when fisher moves from below to above the signal.
• A crossunder occurs when fisher moves from above to below the signal.
e) Threshold Checking
Users typically define oversold and overbought levels (often -1 and +1).
Depending on aggressiveness settings (conservative, moderate, aggressive), these thresholds are slightly shifted to filter out or include more signals.
For example, an oversold threshold of -1 might be used in a moderate setting, whereas -1.5 could be used in a conservative setting to require a deeper dip before triggering.
f) Divergence Checks
The script looks back a specified number of bars (divergenceLookback). For both price and the fisher line, it identifies:
• priceHigh = the highest hl2 within the lookback
• priceLow = the lowest hl2 within the lookback
• fisherHigh = the highest fisher value within the lookback
• fisherLow = the lowest fisher value within the lookback
If price forms a lower low while fisher forms a higher low, it can signal a bullish divergence. Conversely, if price forms a higher high while fisher forms a lower high, a bearish divergence might be indicated.
g) Bar Coloring
The script monitors the absolute change in Fisher values from one bar to the next (sometimes called fisherChange):
fisherChange = abs(fisher - fisher )
If fisherChange exceeds a user-defined intensityThreshold, bars are recolored to highlight a surge of momentum. Aqua might indicate a strong bullish surge, while purple might indicate a strong bearish surge.
This color-coding provides a quick visual cue for traders looking to spot large momentum swings without constantly monitoring indicator values.
8. Signal Generation and Filtering
Buy and sell signals occur when the Fisher line crosses the signal line in regions defined as oversold or overbought. The optional minimum movement filter prevents triggering if Fisher and its signal line are too close, reducing the chance of small, inconsequential price fluctuations creating frequent signals. Divergences that appear in oversold or overbought regions can serve as additional evidence that momentum might soon shift.
9. Visualization on the Chart
Uptrick: Fisher Eclipse plots two lines: the Fisher line in one color and the signal line in a contrasting shade. The chart displays horizontal dashed lines where the overbought and oversold levels lie. When the Fisher Transform experiences a sharp jump or drop above the intensity threshold, the corresponding price bars may change color, signaling that momentum has undergone a noticeable shift. If the indicator detects bullish or bearish divergence, dotted lines are drawn on the oscillator portion to connect the relevant points.
10. Market Adaptability
Because of the different aggressiveness levels and the optional minimum movement filter, Uptrick: Fisher Eclipse can be tailored to multiple trading styles. For instance, a short-term scalper might select a smaller length and more aggressive thresholds, while a swing trader might choose a longer length for smoother readings, along with conservative thresholds to ensure fewer but potentially stronger signals. During strongly trending markets, users might rely more on divergences or large intensity changes, whereas in a range-bound market, oversold or overbought conditions may be more frequent.
11. Risk Management Considerations
Indicators alone do not ensure favorable outcomes, and relying solely on any one signal can be risky. Using a stop-loss or other protections is often suggested, especially in fast-moving or unpredictable markets. Divergence can appear before a market reversal actually starts. Similarly, a Fisher Transform can remain in an overbought or oversold region for extended periods, especially if the trend is strong. Cautious interpretation and confirmation with additional methods or chart analysis can help refine entry and exit decisions.
12. Combining with Other Tools
Traders can potentially strengthen signals from Uptrick: Fisher Eclipse by checking them against other methods. If a moving average cross or a price pattern aligns with a Fisher crossover, the combined evidence might provide more certainty. Volume analysis may confirm whether a shift in market direction has participation from a broad set of traders. Support and resistance zones could reinforce overbought or oversold signals, particularly if price reaches a historical boundary at the same time the oscillator indicates a possible reversal.
13. Parameter Customization and Examples
Some short-term traders run a 15-minute chart, with a shorter length setting, aggressively tight oversold and overbought thresholds, and a smaller divergence lookback. This approach produces more frequent signals, which may appeal to those who enjoy fast-paced trading. More conservative traders might apply the indicator to a daily chart, using a larger length, moderate threshold levels, and a bigger divergence lookback to focus on broader market swings. Results can differ, so it may be helpful to conduct thorough historical testing to see which combination of parameters aligns best with specific goals.
14. Realistic Expectations
While the Fisher Transform can reveal potential turning points, no mathematical tool can predict future price behavior with full certainty. Markets can behave erratically, and a period of strong trending may see the oscillator pinned in an extreme zone without a significant reversal. Divergence signals sometimes appear well before an actual trend change occurs. Recognizing these limitations helps traders manage risk and avoids overreliance on any one aspect of the script’s output.
15. Theoretical Background
The Fisher Transform uses a logarithmic formula to map a normalized input, typically ranging between -1 and +1, into a scale that can fluctuate around values like -3 to +3. Because the transformation exaggerates higher and lower readings, it becomes easier to spot when the market might have stretched too far, too fast. Uptrick: Fisher Eclipse builds on that foundation by adding a series of practical tools that help confirm or refine those signals.
16. Originality and Uniqueness
Uptrick: Fisher Eclipse is not simply a duplicate of the basic Fisher Transform. It enhances the original design in several ways, including built-in divergence detection, bar-color triggers for momentum surges, thresholds for overbought and oversold levels, and customizable signal aggressiveness. By unifying these concepts, the script seeks to reduce noise and highlight meaningful shifts in market direction. It also places greater emphasis on helping traders adapt the indicator to their specific style—whether that involves frequent intraday signals or fewer, more robust alerts over longer timeframes.
17. Summary
Uptrick: Fisher Eclipse is an expanded take on the original Fisher Transform oscillator, including divergence detection, bar coloring based on momentum strength, and flexible signal thresholds. By adjusting parameters like length, aggressiveness, and intensity thresholds, traders can configure the script for day-trading, swing trading, or position trading. The indicator endeavors to highlight where price might be shifting direction, but it should still be combined with robust risk management and other analytical methods. Doing so can lead to a more comprehensive view of market conditions.
18. Disclaimer
No indicator or script can guarantee profitable outcomes in trading. Past performance does not necessarily suggest future results. Uptrick: Fisher Eclipse is provided for educational and informational purposes. Users should apply their own judgment and may want to confirm signals with other tools and methods. Deciding to open or close a position remains a personal choice based on each individual’s circumstances and risk tolerance.

JJ Highlight Time Ranges with First 5 Minutes and LabelsTo effectively use this Pine Script as a day trader , here’s how the various elements can help you manage trades, track time sessions, and monitor price movements:
Key Components for a Day Trader:
1. First 5-Minute Highlight:
- Purpose: Day traders often rely on the first 5 minutes of the trading session to gauge market sentiment, watch for opening price gaps, or plan entries. This script draws a horizontal line at the high or low of the first 5 minutes, which can act as a key level for the rest of the day.
- How to Use: If the price breaks above or below the first 5-minute line, it can signal momentum. You might enter a long position if the price breaks above the first 5-minute high or a short if it breaks below the first 5-minute low.
2. Session Time Highlights:
- Morning Session (9:15–10:30 AM): The market often shows its strongest price action during the first hour of trading. This session is highlighted in yellow. You can use this highlight to focus on the most volatile period, as this is when large institutional moves tend to occur.
- Afternoon Session (12:30–2:55 PM): The blue highlight helps you track the mid-afternoon session, where liquidity may decrease, and price action can sometimes be choppier. Day traders should be more cautious during this period.
- How to Use: By highlighting these key times, you can:
- Focus on key breakouts during the morning session.
- Be more conservative in your trades during the afternoon, as market volatility may drop.
3. Dynamic Labels:
- Top/Bottom Positioning: The script places labels dynamically based on the selected position (Top or Bottom). This allows you to quickly glance at the session's start and identify where you are in terms of time.
- How to Use: Use these labels to remind yourself when major time segments (morning or afternoon) begin. You can adjust your trading strategy depending on the session, e.g., being more aggressive in the morning and more cautious in the afternoon.
Trading Strategy Suggestions:
1. Momentum Trades:
- After the first 5 minutes, use the high/low of that period to set up breakout trades.
- Long Entry: If the price breaks the high of the first 5 minutes (especially if there's a strong trend).
- Short Entry: If the price breaks the low of the first 5 minutes, signaling a potential downtrend.
2. Session-Based Strategy:
- Morning Session (9:15–10:30 AM):
- Look for strong breakout patterns such as support/resistance levels, moving average crossovers, or candlestick patterns (like engulfing candles or pin bars).
- This is a high liquidity period, making it ideal for executing quick trades.
- Afternoon Session (12:30–2:55 PM):
- The market tends to consolidate or show less volatility. Scalping and mean-reversion strategies work better here.
- Avoid chasing big moves unless you see a clear breakout in either direction.
3. Support and Resistance:
- The first 5-minute high/low often acts as a key support or resistance level for the rest of the day. If the price holds above or below this level, it’s an indication of trend continuation.
4. Breakout Confirmation:
- Look for breakouts from the highlighted session time ranges (e.g., 9:15 AM–10:30 AM or 12:30 PM–2:55 PM).
- If a breakout happens during a key time window, combine that with other technical indicators like volume spikes , RSI , or MACD for confirmation.
---
Example Day Trader Usage:
1. First 5 Minutes Strategy: After the market opens at 9:15 AM, watch the price action for the first 5 minutes. The high and low of these 5 minutes are critical levels. If the price breaks above the high of the first 5 minutes, it might indicate a strong bullish trend for the day. Conversely, breaking below the low may suggest bearish movement.
2. Morning Session: After the first 5 minutes, focus on the **9:15 AM–10:30 AM** window. During this time, look for breakout setups at key support/resistance levels, especially when paired with high volume or momentum indicators. This is when many institutions make large trades, so price action tends to be more volatile and predictable.
3. Afternoon Session: From 12:30 PM–2:55 PM, the market might experience lower volatility, making it ideal for scalping or range-bound strategies. You could look for reversals or fading strategies if the market becomes too quiet.
Conclusion:
As a day trader, you can use this script to:
- Track and react to key price levels during the first 5 minutes.
- Focus on high volatility in the morning session (9:15–10:30 AM) and **be cautious** during the afternoon.
- Use session-based timing to adjust your strategies based on the time of day.

Previous Week High & Low with middle lineDescription:
The Previous Week High & Low Indicator is a powerful tool designed to provide traders with key reference levels from the previous trading week. It dynamically calculates and plots the previous week's high, low, and midpoint levels directly on your chart, helping you identify critical support and resistance zones.
Features:
1. **Previous Week High and Low Lines**:
- The indicator displays the high and low prices of the previous trading week, allowing you to analyze price action relative to these levels.
- These lines are plotted as step lines, visible only during the active trading days (Monday to Friday), ensuring clean and uncluttered charts.
2. Midpoint Line:
- The midpoint between the previous week's high and low is calculated and displayed as a reference level.
- This white line can act as a psychological pivot point for market participants.
3. Customizable Display:
- You can toggle the visibility of the high and low lines using input options, tailoring the indicator to your preferences.
4. Precision and Aesthetics:
- The lines are plotted with precision and styled for clarity, using subtle transparency for an unobtrusive yet informative appearance.
Use Case:
- This indicator is ideal for traders who rely on historical price levels for planning entries, exits, or stop-loss placements.
- It works seamlessly with any timeframe and asset, making it versatile for various trading strategies.
How It Works:
- The indicator fetches the previous week's high and low prices using the weekly timeframe and "lookahead" mode to ensure these levels remain static after the week's close.
- The lines are plotted only on weekdays (Monday to Friday) to exclude weekend data, ensuring accuracy for markets that operate 24/5.
This tool simplifies your chart analysis and empowers you to make informed trading decisions based on historical price dynamics.

Fibonacci Extensions and Retracements for Selected TimeframesPurpose of the Script
This script plots Fibonacci levels (retracements and extensions) based on the high and low points of the previous day, previous week, or previous month. It is a trading aid to help identify potential support and resistance zones. These zones are often used by traders to determine entry or exit points for trades.
How It Works
Select Timeframe
The trader can choose whether to calculate Fibonacci levels based on the high and low points of the previous day, previous week, or previous month.
This is selected using the timeframe_input input.
Examples:
"D" for the previous day
"W" for the previous week
"M" for the previous month
Calculate Price Range
The script calculates the price range using the high and low of the selected timeframe:
Formula: price_range = High - Low
Draw Fibonacci Levels
Retracements: Within the price range, Fibonacci levels such as 12%, 23%, 38%, 50%, 61%, 78%, and 88% are calculated. These help identify potential support or resistance zones.
Extensions: Beyond the price range, Fibonacci extensions such as 127%, 161%, 200%, 224%, and 241% are plotted to indicate potential breakout targets.
Visualization
The script plots lines and labels for each level.
These lines extend to the right, providing real-time guidance during trading.
Colors and line styles can be customized to match personal preferences.
How to Use as a Trading Aid
Use Fibonacci Retracements:
Use retracements (e.g., 38%, 50%, 61%) to identify potential support or resistance zones.
Example: If the price dropped sharply the previous day, the retracement levels could act as support during a rebound.
Use Fibonacci Extensions:
Extensions help identify price targets when the price breaks above or below the high or low of the previous day, week, or month.
Example: After a breakout above the previous week’s high, the 127% or 161% level could serve as a target.
Adjust Timeframe:
Choose the timeframe that suits your strategy:
Intraday traders can use the previous day’s high and low.
Swing traders might prefer the previous week.
Long-term traders could work with the previous month.
Example
A trader selects the weekly timeframe (W) to analyze the high and low of the previous week:
The script calculates the price range based on the high and low of the previous week.
Fibonacci retracements (e.g., 50% and 61%) are drawn to identify potential support zones.
Fibonacci extensions (e.g., 127% and 161%) help define price targets for a potential breakout above or below the range.

Pivot Highs/Lows with Bar CountsWhat does the indicator do?
This indicator adds labels to a chart at swing (a.k.a., "pivot") highs and lows. Each label may contain a date, the closing price at the swing, the number of bars since the last swing in the same direction, and the number of bars from the last swing in the opposite direction. A table is also added to the chart that shows the average, min, and max number of bars between swings.
OK, but how do I use it?
Many markets -- especially sideways-moving ones -- commonly cycle between swing highs and lows at regular time intervals. By measuring the number of bars between highs and lows -- both same-sided swings (i.e., H-H and L-L) and opposite-sided swings (i.e., H-L and L-H) -- you can then project the averages of those bar counts from the last high or low swing to make predictions about where the next swing high or low should occur. Note that this indicator does not make the projection for you. You have to determine which swing you want to project from and then use the bar counts from the indicator to draw a line, place a label, etc.
Example: Chart of BTC/USD
The indicator shows pivot highs and lows with bar counts, and it displays a table of stats on those pivots.
If you focus on the center section of the chart, you can see that prices were moving in a sideways channel with very regular highs and lows. This indicator counts the bars between these pivots, and you could have used those counts to predict when the next high or low may have occurred.
The bar counts do not work as well on the more recent section of the chart because there are no regularly time swings.

AiTrend Pattern Matrix for kNN Forecasting (AiBitcoinTrend)The AiTrend Pattern Matrix for kNN Forecasting (AiBitcoinTrend) is a cutting-edge indicator that combines advanced mathematical modeling, AI-driven analytics, and segment-based pattern recognition to forecast price movements with precision. This tool is designed to provide traders with deep insights into market dynamics by leveraging multivariate pattern detection and sophisticated predictive algorithms.
👽 Core Features
Segment-Based Pattern Recognition
At its heart, the indicator divides price data into discrete segments, capturing key elements like candle bodies, high-low ranges, and wicks. These segments are normalized using ATR-based volatility adjustments to ensure robustness across varying market conditions.
AI-Powered k-Nearest Neighbors (kNN) Prediction
The predictive engine uses the kNN algorithm to identify the closest historical patterns in a multivariate dictionary. By calculating the distance between current and historical segments, the algorithm determines the most likely outcomes, weighting predictions based on either proximity (distance) or averages.
Dynamic Dictionary of Historical Patterns
The indicator maintains a rolling dictionary of historical patterns, storing multivariate data for:
Candle body ranges, High-low ranges, Wick highs and lows.
This dynamic approach ensures the model adapts continuously to evolving market conditions.
Volatility-Normalized Forecasting
Using ATR bands, the indicator normalizes patterns, reducing noise and enhancing the reliability of predictions in high-volatility environments.
AI-Driven Trend Detection
The indicator not only predicts price levels but also identifies market regimes by comparing current conditions to historically significant highs, lows, and midpoints. This allows for clear visualizations of trend shifts and momentum changes.
👽 Deep Dive into the Core Mathematics
👾 Segment-Based Multivariate Pattern Analysis
The indicator analyzes price data by dividing each bar into distinct segments, isolating key components such as:
Body Ranges: Differences between the open and close prices.
High-Low Ranges: Capturing the full volatility of a bar.
Wick Extremes: Quantifying deviations beyond the body, both above and below.
Each segment contributes uniquely to the predictive model, ensuring a rich, multidimensional understanding of price action. These segments are stored in a rolling dictionary of patterns, enabling the indicator to reference historical behavior dynamically.
👾 Volatility Normalization Using ATR
To ensure robustness across varying market conditions, the indicator normalizes patterns using Average True Range (ATR). This process scales each component to account for the prevailing market volatility, allowing the algorithm to compare patterns on a level playing field regardless of differing price scales or fluctuations.
👾 k-Nearest Neighbors (kNN) Algorithm
The AI core employs the kNN algorithm, a machine-learning technique that evaluates the similarity between the current pattern and a library of historical patterns.
Euclidean Distance Calculation:
The indicator computes the multivariate distance across four distinct dimensions: body range, high-low range, wick low, and wick high. This ensures a comprehensive and precise comparison between patterns.
Weighting Schemes: The contribution of each pattern to the forecast is either weighted by its proximity (distance) or averaged, based on user settings.
👾 Prediction Horizon and Refinement
The indicator forecasts future price movements (Y_hat) by predicting logarithmic changes in the price and projecting them forward using exponential scaling. This forecast is smoothed using a user-defined EMA filter to reduce noise and enhance actionable clarity.
👽 AI-Driven Pattern Recognition
Dynamic Dictionary of Patterns: The indicator maintains a rolling dictionary of N multivariate patterns, continuously updated to reflect the latest market data. This ensures it adapts seamlessly to changing market conditions.
Nearest Neighbor Matching: At each bar, the algorithm identifies the most similar historical pattern. The prediction is based on the aggregated outcomes of the closest neighbors, providing confidence levels and directional bias.
Multivariate Synthesis: By combining multiple dimensions of price action into a unified prediction, the indicator achieves a level of depth and accuracy unattainable by single-variable models.
Visual Outputs
Forecast Line (Y_hat_line):
A smoothed projection of the expected price trend, based on the weighted contribution of similar historical patterns.
Trend Regime Bands:
Dynamic high, low, and midlines highlight the current market regime, providing actionable insights into momentum and range.
Historical Pattern Matching:
The nearest historical pattern is displayed, allowing traders to visualize similarities
👽 Applications
Trend Identification:
Detect and follow emerging trends early using dynamic trend regime analysis.
Reversal Signals:
Anticipate market reversals with high-confidence predictions based on historically similar scenarios.
Range and Momentum Trading:
Leverage multivariate analysis to understand price ranges and momentum, making it suitable for both breakout and mean-reversion strategies.
Disclaimer: This information is for entertainment purposes only and does not constitute financial advice. Please consult with a qualified financial advisor before making any investment decisions.

Fibonacci Moving Average PlusFibonacci Moving Average Plus is a sophisticated technical indicator that employs the first 15 numbers of the Fibonacci sequence to create dynamic moving average channels. This indicator aims to capture both immediate and long-term price movements by calculating Exponential Moving Averages (EMAs) based on these Fibonacci values. By using Fibonacci-based moving averages for both high and low price points, the indicator generates a visual channel that reflects the ebb and flow of market trends, acting as potential zones of support and resistance. Additionally, the indicator provides midline, retracement, and extension levels rooted in Fibonacci ratios, which are frequently observed as key levels for reversals or trend continuation.
Ideology Behind Using Fibonacci Sequence-Based Moving Averages
The Fibonacci sequence, known for its mathematical harmony and prevalence in natural patterns, is widely utilized in technical analysis to identify potential turning points in markets. In this indicator, the first 15 Fibonacci numbers (5, 8, 13, 21, etc.) are used as the lookback periods for EMAs to capture different layers of market sentiment. These moving averages represent timeframes that are theoretically in alignment with the natural rhythms of market cycles, where key levels—often coinciding with Fibonacci numbers—can act as magnetic points for price.
The Fibonacci high and low channels aim to encapsulate price action, giving traders a sense of whether the market is trending, consolidating, or experiencing reversal pressure. These levels, grounded in both mathematics and market psychology, help traders spot areas where price might face resistance or find support.
Key Features
Fibonacci Moving Average High and Low: This indicator calculates the high and low EMAs based on Fibonacci sequence numbers (e.g., 5, 8, 13, etc.) for enhanced trend analysis.
Golden Pocket Retracement (GPR) and Extension (GPE) Bands: Displays common Fibonacci retracement and extension levels (0.618, 0.65 for retracement, and 1.618, 1.65 for extension).
Midline: Plots the average of the Fibonacci high and low to act as an additional reference level.
Stop-Loss Levels: Provides suggested stop-loss levels based on Fibonacci levels for both long and short positions.
Basic User Guide
Adjust Input Settings:
Input Timeframe: Set a specific timeframe for the Fibonacci moving average calculation, separate from the chart's primary timeframe.
Show Fibonacci MA High/Low: Toggle the visibility of the high and low Fibonacci moving averages.
Show Mid Line: Display a midline for added trend reference.
Show Golden Pocket Bands: Choose to display retracement or extension bands for potential support or resistance zones.
Show Stop-Loss Levels: Enable to visualize potential stop-loss levels for both long and short trades.
Interpretation:
Fibonacci MA High and Low: Use these lines to gauge the general trend. When the price is above both, it may indicate an uptrend; below both, a downtrend.
Golden Pocket Retracement: This zone (between 0.618 and 0.65) is often a key level for potential reversals or support/resistance.
Golden Pocket Extension: The 1.618 and 1.65 levels can indicate potential profit-taking or trend exhaustion points.
Stop-Loss Levels: The calculated stop-loss levels (long SL below and short SL above) can aid in risk management.
Customization:
You can customize the appearance and visibility of each component through the input settings to fit your specific strategy and visual preferences.
This indicator should be used alongside other technical analysis tools to provide a more comprehensive trading approach.
This Indicator would not exist without the original contributions and blessing from Sofien Kaabar

CandlestickPatternsLibrary "CandlestickPatterns"
zigzag(_low, _high, depth, deviation, backstep)
Parameters:
_low (float)
_high (float)
depth (int)
deviation (int)
backstep (int)
getTrend(trendType, currentClose, zz_downtrend, zz_uptrend, ema14, ema28)
Parameters:
trendType (string)
currentClose (float)
zz_downtrend (bool)
zz_uptrend (bool)
ema14 (float)
ema28 (float)
isInside(currentHigh, currentLow, currentClose, currentOpen, prevHigh, prevLow)
Parameters:
currentHigh (float)
currentLow (float)
currentClose (float)
currentOpen (float)
prevHigh (float)
prevLow (float)
checkMorningStar(open0, high0, low0, close0, open1, high1, low1, close1, open2, high2, low2, close2, innerCandleThreshold, closingMinThreshold, closingMaxThreshold, useDojiFilter, dojiSize, downTrend)
Parameters:
open0 (float)
high0 (float)
low0 (float)
close0 (float)
open1 (float)
high1 (float)
low1 (float)
close1 (float)
open2 (float)
high2 (float)
low2 (float)
close2 (float)
innerCandleThreshold (float)
closingMinThreshold (float)
closingMaxThreshold (float)
useDojiFilter (bool)
dojiSize (float)
downTrend (bool)
checkEveningStar(open0, high0, low0, close0, open1, high1, low1, close1, open2, high2, low2, close2, innerCandleThreshold, closingMinThreshold, closingMaxThreshold, useDojiFilter, dojiSize, upTrend)
Parameters:
open0 (float)
high0 (float)
low0 (float)
close0 (float)
open1 (float)
high1 (float)
low1 (float)
close1 (float)
open2 (float)
high2 (float)
low2 (float)
close2 (float)
innerCandleThreshold (float)
closingMinThreshold (float)
closingMaxThreshold (float)
useDojiFilter (bool)
dojiSize (float)
upTrend (bool)
checkHammerPattern(open, high, low, close, bodyAvg, shadowFactor, downTrend)
Parameters:
open (float)
high (float)
low (float)
close (float)
bodyAvg (float)
shadowFactor (float)
downTrend (bool)
checkInvertedHammerPattern(open, high, low, close, bodyAvg, shadowFactor, downTrend)
Parameters:
open (float)
high (float)
low (float)
close (float)
bodyAvg (float)
shadowFactor (float)
downTrend (bool)
checkHangingManPattern(open, high, low, close, bodyAvg, shadowFactor, upTrend)
Parameters:
open (float)
high (float)
low (float)
close (float)
bodyAvg (float)
shadowFactor (float)
upTrend (bool)
checkShootingStarPattern(open, high, low, close, bodyAvg, shadowFactor, upTrend)
Parameters:
open (float)
high (float)
low (float)
close (float)
bodyAvg (float)
shadowFactor (float)
upTrend (bool)
checkLevels(high0, high1, high2, low0, low1, low2, lookbackPeriod)
Parameters:
high0 (float)
high1 (float)
high2 (float)
low0 (float)
low1 (float)
low2 (float)
lookbackPeriod (int)
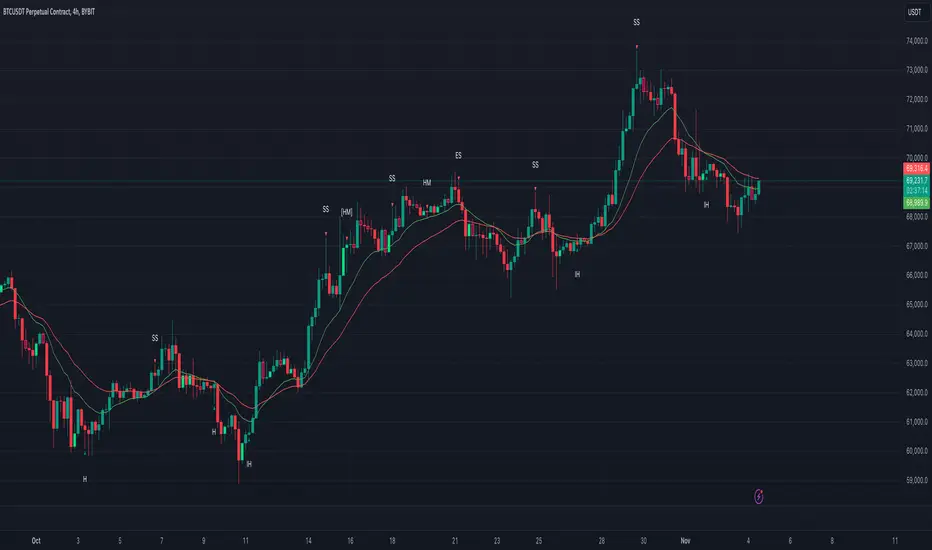
MSTR-BTC PremiumThis custom indicator, “MSTR-BTC Premium with High, Average, and Low Levels,” helps you analyze the premium of MicroStrategy Incorporated’s (MSTR) stock price in relation to its Bitcoin holdings. By comparing the market capitalization of MSTR to the value of its Bitcoin holdings (using BTCUSD from Coinbase), this indicator calculates a premium that reflects how much the stock price deviates from its Bitcoin-related value.
Key Features:
• Premium Line: The primary feature is the “Premium,” which shows the ratio of MSTR’s market cap relative to its Bitcoin holdings and the BTCUSD price.
• High, Average, and Low Levels: The indicator calculates the highest, lowest, and average premium values over a user-defined period (default is 14 bars). These levels help identify overbought and oversold conditions relative to the stock’s Bitcoin valuation.
• Visual Shading: The area between the premium line and the average is shaded, making it easier to see when the premium is above or below its typical level. Optional shading is also available between the high and low levels to visualize the price range.
How to Use:
• Overbought/Undervalued Conditions: When the premium line rises significantly above the average, it may indicate that MSTR stock is overbought compared to its Bitcoin holdings. Conversely, when the premium falls below the average or approaches the low line, it might signal an undervalued opportunity.
• Trend and Mean Reversion: The high and low lines provide insight into extreme levels. Monitoring these alongside the average can assist in identifying potential mean reversion trades.
Customization:
• Calculation Period: The period for calculating the high, low, and average values can be adjusted to suit your trading strategy (default is 14).
• Shading Options: By default, the area between the premium and its average is shaded. You can enable or disable the shading between the high and low as needed.
This indicator is particularly useful for traders and investors following MicroStrategy (MSTR) and its Bitcoin strategy, providing a deeper understanding of the stock’s relationship to its underlying Bitcoin assets. It can assist in identifying key levels for decision-making based on deviations from historical norms.
How to Add the Indicator:
1. Adjust the calculation period (default is 14) to customize the analysis according to your preferred timeframe.
2. Watch for significant deviations of the premium line from its average to identify potential overbought/oversold conditions.
3. Use the high and low levels to help gauge extreme premium values and possible mean reversion opportunities.
Enjoy the analysis and make more informed decisions with the MSTR-BTC Premium Indicator!
This description should be clear and informative for anyone considering using your indicator. It highlights the functionality, purpose, and customization options in a straightforward way. Let me know if you’d like to tweak or adjust any part of it!
